NCT

NCT Water Pump Station

Project Controls Dashboard — Cost & Schedule Report

Ports Development Co.BEA Technology CompanyAECOM
Project 3D View Site Progress Photos
Project Lead: Eng. Mohamad Deeb El Mohsen
Budget (BAC): SAR 245,000
P.O. Number: 3071
Date updated: 24 October 2026
Previous update: 17 October 2026
Site photos: 14 in the gallery
Baseline programme: 15 Feb 2026 – 26 Nov 2026
01

Executive summary

Reporting date 24 October 2026 · P.O. Number 3071
Weighted physical progress
32.95%
Planned 30.19% · +2.75 pts ahead
Schedule performance index (SPI)
1.09
SV +SAR 6,753 · ahead
Cost performance index (CPI)
1.15
CV +SAR 10,725 on cost recorded · provisional
Earned value (EV)
SAR 80,725
32.95% of the budget at completion
Planned value (PV)
SAR 73,972
30.19% of the budget at completion
Actual cost (AC)
SAR 70,000
28.57% of the budget at completion · tanks package not costed
Budget at completion (BAC)
SAR 245,000
P.O. Number 3071
Estimate at completion (EAC)
SAR 212,450
VAC +SAR 32,550 on recorded cost
Forecast completion
26 Nov 2026
Baseline 26 Nov 2026 · 0 working days
Activities
20
5 completed · 3 in progress · 12 not started
Contractual milestones
6
2 achieved · 4 ahead
Critical activities
9
zero total float, of 15 open
Overall health — AMBER
Measured against the baseline dates, the weightage and the cost columns of the schedule of 24 October 2026, and against the position last reported on 17 October 2026.
DimensionRatingBasis
Schedule performanceGREENSPI 1.09 with earned value SAR 80,725 against planned value SAR 73,972, schedule variance +SAR 6,753; physical progress 32.95% against 30.19% planned, +2.75 points, of which +7.15 points were earned in the week to 24 October.
Completion dateAMBERForecast completion 26 Nov 2026 equals the baseline of 26 Nov 2026, but 9.1 is at 75% with its planned finish of 21 October already passed, and the tanks package (44.9% of the weight) carries 18 working days to 15 November.
Cost performanceAMBERCPI 1.15 on the SAR 70,000 of cost recorded to date (CV +SAR 10,725, EAC SAR 212,450); the SAR 110,000 tanks package is 15% delivered with no cost posted, so the index is not yet a true cost position.
Critical pathAMBER9 of the 15 open activities carry zero total float and 68.2% of the weighted value of the works sits in the activities that drive the 15 to 26 November window.
Data qualityAMBERThe actual cost column of the schedule repeats the activity budget (SAR 110,000 on 9.2 at 15% complete, SAR 20,500 on the electrical package at 0%); 9.1 shows 75% with a finish of 21 October; and actual starts are recorded earlier than the baseline on 9.1 (10 Oct), 9.2 (18 Oct) and 10.2 (20 Oct).
02

Key decisions and progress

For the Project Lead · reporting date 24 October 2026
S-curve — cumulative weighted progress
Planned 30.19% · earned 32.95% · +2.75 points at the data date
0%025%61,25050%122,50075%183,750100%245,000FebMarAprMayJunJulAugSepOctNov Data date 24 Oct 2026 30.19% planned 32.95% earned Cumulative weighted progress · left axis % · right axis SAR of the budget at completion
Planned (baseline dates and weightage)Earned (reported progress and actual dates)┆ Data date 24 Oct 2026
Planned curve from baseline dates and the activity weightage; earned curve from reported progress and actual dates. 216 of the 245 working days of the programme had elapsed at the data date.
Key decisions required
Five decisions from the schedule of 24 October 2026 · owners assigned at the weekly progress meeting
1
Close out Steel Beam Foundation (9.1)
9.1 stands at 75% with its planned finish of 21 October passed: 3 days of exposure on the feeder to 44.9% of the weight. Decision: confirm the last 25% with its evidence at the 24 October meeting and sign the activity off, releasing the whole crew to the tanks.
2
Fix the tanks assembly cycle (9.2)
9.2 reached 15% in its first week from an early start on 18 October. 44.9% of the project weight now has 18 working days to 15 November. Decision: agree the plate deliveries, the crane and the welding crew for two rings a week, or re-sequence the assembly.
3
Decide the early start on Pipes & Fittings (10.2)
10.2 is at 40% against a baseline start of 18 November and gates Hydrotest (10.3) on 23 November. It carries SAR 2,600 of earned value, 1.06 points of the week. Decision: re-link 10.1, 10.2 and 10.3 to follow the early start, or park the work to protect the tanks sequence.
4
Post the cost of the tanks package
SAR 70,000 is recorded against SAR 80,725 of earned value, with the SAR 110,000 tanks package at 15% and no cost posted. Decision: code and post the steel and tank invoices so CPI and EAC describe the works and not the lag in cost capture.
5
Recover the 2 working days on milestones 3 to 6
All four remaining contractual milestones still forecast 2 working days behind their contract dates (17, 18, 21 and 24 November). The 4-day early start of 9.2 is the first recovery. Decision: agree the second day before 15 November, as no float exists to absorb it.
03

Planned vs actual — progress checkpoints

Baseline dates, weightage and reported progress
CheckpointWhat it measuresPlannedActualVariance
24 Feb 2026Engineering drawings complete (7.1, 7.2, 7.3)6.12%6.12%0.00 pts
30 Jun 2026Civil and structural works complete (8.1, 8.2)22.86%22.86%0.00 pts
17 Oct 2026Previous update — last reported position24.69%25.80%+1.10 pts
24 Oct 2026Data date — weighted progress reported now30.19%32.95%+2.75 pts
The engineering and civil checkpoints closed exactly on plan. The +2.75 points at 24 October 2026 come from three movements: Tanks Assembly (9.2) at 15% against 9.52% planned, +2.46 points on its early start of 18 October; Pipes & Fittings (10.2) at 40% against 0 planned, +1.06 points on its early start of 20 October; and Steel Beam Foundation (9.1) at 75% against 100% planned, −0.77 points.
UPDATES

Reporting history

Newest first · earlier reports are kept as issued
Progress by update
24 October 2026 Report as issued
Data date 24 October 2026 · weighted progress 32.95% against 30.19% planned · +2.75 pts · +7.15 pts in the week
Tanks Assembly (9.2) at 15% from an early start on 18 October; Pipes & Fittings (10.2) at 40% from an early start on 20 October; Steel Beam Foundation (9.1) at 75% with its planned finish of 21 October passed. Earned value SAR 80,725, cost recorded SAR 70,000.
  • Progress moved from 25.80% to 32.95% in the week.
  • Two activities started early; one is behind on dates (9.1).
  • Forecast completion unchanged at 26 November 2026.
This reportSite photos of 24 October
17 October 2026 Previous report
Data date 17 October 2026 · weighted progress 25.80% against 24.69% planned · +1.10 pts
Engineering drawings and civil works complete. Steel Beam Foundation (9.1) at 70% against 60% planned; Pipes & Fittings (10.2) reported 30% before its scheduled start; tanks assembly not started. Earned value SAR 63,200, cost recorded SAR 70,000.
  • Kept as issued: its figures are not restated.
  • Site photos of that week are in the same gallery.
Open the 17 October reportSite photos of 17 October
Position at each data date
Data dateProgressPlannedVarianceEarned valueReport
24 Oct 202632.95%30.19%+2.75 ptsSAR 80,725Current
17 Oct 202625.80%24.69%+1.10 ptsSAR 63,200Archived
Each report is a snapshot: the figures of 17 October 2026 are shown as issued, not restated. Weekly gain in the progress register is measured between the two data dates.
Site Progress Photos (14)
04

Cost and earned value

Planned value, earned value and actual cost
At the data date, SAR
Planned value
73,972
Earned value
80,725
Actual cost
70,000
Budget (BAC)
245,000
Cost variance (CV = EV − AC)+SAR 10,725
Schedule variance (SV = EV − PV)+SAR 6,753
Cost performance index (CPI)1.15
Schedule performance index (SPI)1.09
Estimate at completion (EAC = BAC ÷ CPI)SAR 212,450
Variance at completion (VAC = BAC − EAC)+SAR 32,550
Budget spent to date (AC ÷ BAC)28.57%
Cost and progress by workstream
WBSWorkstreamWeightPVEVACCVCPI
7Engineering Drawings6.12%15,00015,00015,00001.00
8Civil & Structural Works16.73%41,00041,00041,00001.00
9Tanks Errection53.27%17,97222,1257,50014,6252.95
10Mechanical Works13.06%02,6006,500−3,9000.40
11Electrical & Control Panels8.37%0000n/a
12Testing & Commissioning2.45%0000n/a
–Total100.00%73,97280,72570,00010,7251.15
The baseline cost carried by the activities totals SAR 250,000 while the approved budget at completion is SAR 245,000: the civil and structural baseline was re-estimated from SAR 46,000 to SAR 41,000, and the weightage follows the re-estimated value. AC is the cost recorded to the data date: where a package has no cost posted (9.2 and the electrical package), its workstream CPI is not yet meaningful and is read with the note below the total.
05

Progress by workstream

Planned marker · actual bar
WBSWorkstreamWeightPlanned / actual completePlannedActualVarianceStatusActivities
7Engineering Drawings6.12%
100.00%100.00%+0.00 ptsCompleted3
8Civil & Structural Works16.73%
100.00%100.00%+0.00 ptsCompleted2
9Tanks Errection53.27%
13.77%16.95%+3.18 ptsIn Progress6
10Mechanical Works13.06%
0.00%8.12%+8.12 ptsIn Progress3
11Electrical & Control Panels8.37%
0.00%0.00%+0.00 ptsPlanned4
12Testing & Commissioning2.45%
0.00%0.00%+0.00 ptsPlanned2
–Total100.00%30.19%32.95%+2.75 pts20
Variance is percentage points of weighted progress (actual minus planned at the data date).
06

Activity status and float

Activities by status
5Completed3In Progress12Not Started20Total
20 activities in the schedule: 5 completed, 3 in progress, 12 not started.
Total float of the 15 open activities, working days
9.1 Steel Beam Foundation09.2 Tanks Assembly09.3 Ladder, Vent, SS Supports99.4 Mechanical Level Indicator09.5 Overall Finishing09.6 Testing (tanks)310.1 Pumps Installation010.2 Pipes & Fittings Installation010.3 Testing – Hydrotest011.1 Electrical Cables, Switches, Trays511.2 Level Control Panel Installation111.3 Pump Control Panel Installation011.4 Testing (electrical)312.1 Function & Operation Test112.2 Documentation & As Built0
Zero total float: 9 activities (red).
07

Contractual milestones

Schedule rows 1–6 · end date only
#MilestoneContract dateStatusWorkstream forecast finishVariance (working days)
M1Engineering Drawings08 Mar 2026Achieved24 Feb 2026 (actual)−10
M2Civil & Structural Works30 Jun 2026Achieved30 Jun 2026 (actual)0
M3Tanks Errection17 Nov 2026In progress19 Nov 2026+2
M4Mechanical Installation21 Nov 2026In progress23 Nov 2026+2
M5Electrical Installation18 Nov 2026Planned21 Nov 2026+2
M6Testing & Commissioning24 Nov 2026Planned26 Nov 2026+2
Contract date as recorded for milestones 1–6; the workstream forecast finish is the latest activity finish in that workstream in the schedule of 24 October 2026.
08

Forecast completion and days variance

Baseline vs forecast at the data date
Baseline completion
26 Nov 2026
Contract programme, 245 working days from 15 Feb 2026
Forecast completion
26 Nov 2026
From the current dates of the driving chain
Days ahead / behind
0 wd
On the baseline date
Working days remaining
29
25 Oct to 26 Nov 2026, Friday off
Milestone forecast against contract date
Working days, workstream forecast finish against the contract date
M1 · Engineering Drawings-10M2 · Civil & Structural Works0M3 · Tanks Errection+2M4 · Mechanical Installation+2M5 · Electrical Installation+2M6 · Testing & Commissioning+2Working days ahead (left) and behind (right) the contract date
Forecast finish by workstream
WBSWorkstreamWeightBaseline finishForecast finishVar. wd
7Engineering Drawings6.12%24 Feb 202623 Feb 2026−1
8Civil & Structural Works16.73%30 Jun 202630 Jun 20260
9Tanks Errection53.27%19 Nov 202619 Nov 20260
10Mechanical Works13.06%23 Nov 202623 Nov 20260
11Electrical & Control Panels8.37%21 Nov 202621 Nov 20260
12Testing & Commissioning2.45%26 Nov 202626 Nov 20260
No workstream has moved off its baseline finish: the 2-day exposure sits inside milestones 3 to 6, where the forecast finish is later than the contract date even though the work finishes on baseline.
09

Critical path and exposures

Driving chain
9.2 Tanks Assembly→9.4 Mechanical Level Indicator→9.5 Overall Finishing→9.6 Testing→12.1 Function & Operation Test→12.2 Documentation & As Built
10.1 Pumps Installation→10.2 Pipes & Fittings Installation→10.3 Testing – Hydrotest→12.1 Function & Operation Test
9.1 Steel Beam Foundation — feeder into 9.2
Critical activities with zero total float: 9. Activities with float: 9.3 (9 wd), 11.1 (5 wd), 9.6 (3 wd), 11.4 (3 wd), 11.2 (1 wd), 12.1 (1 wd). Total float is computed from the finish-to-start and start-to-start links in the schedule; start-to-start is used only between 12.1 and 12.2.
Top critical exposures
1
Steel Beam Foundation (9.1)
75% complete with its planned finish of 21 October passed, zero total float. It is the only activity behind on dates and it feeds the 44.9% tanks package: 3 days of exposure on the driving chain.
2
Tanks Assembly (9.2)
44.9% of the project weight at 15% after the first week (start 18 October, 4 days early), zero total float, 18 working days left to 15 November. Every ring late moves milestone 3.
3
Pipes & Fittings Installation (10.2)
40% complete on an early start of 20 October against a baseline start of 18 November, zero total float. It gates Hydrotest (10.3) on 23 November and the function test on 24 November, and its logic link to 10.1 is overtaken.
4
Pumps Installation (10.1)
10.20% of the weight, zero total float, 16-17 November; it gates the electrical cables, the pump control panel and the pumps-to-pipe connection that 10.2 has already started.
5
Pump Control Panel Installation (11.3)
Zero total float, 18 November; it gates electrical testing on 19 November and the function test on 24 November.
10

Activity progress register

Weekly update · reporting date 24 October 2026
WBSActivityStatusWeight %Planned %Current %Variance ptsLast week %Weekly gainActual startActual endForecast finishResponsibleComment / evidence
7.1Civil DrawingsCompleted2.04100.0%100%0.00100%015 Feb 202622 Feb 202622 Feb 2026——
7.2Mechanical DrawingsCompleted2.04100.0%100%0.00100%015 Feb 202621 Feb 202621 Feb 2026——
7.3Electrical DrawingsCompleted2.04100.0%100%0.00100%017 Feb 202624 Feb 202624 Feb 2026——
8.1Tanks & Pump Slab FoundationCompleted14.29100.0%100%0.00100%014 Jun 202629 Jun 202629 Jun 2026——
8.2Pipe SupportsCompleted2.45100.0%100%0.00100%020 Jun 202630 Jun 202630 Jun 2026——
9.1Steel Beam FoundationIn Progress3.06100.0%75%-25.0070%+510 Oct 2026—21 Oct 2026——
9.2Tanks AssemblyIn Progress44.909.5%15%+5.480%+1518 Oct 2026—15 Nov 2026——
9.3Ladder, Vent, SS SupportsNot Started0.820.0%0%0.000%0——16 Nov 2026——
9.4Mechanical Level IndicatorNot Started1.630.0%0%0.000%0——16 Nov 2026——
9.5Overall FinishingNot Started0.410.0%0%0.000%0——17 Nov 2026——
9.6Testing (tanks)Not Started2.450.0%0%0.000%0——19 Nov 2026——
10.1Pumps InstallationNot Started10.200.0%0%0.000%0——17 Nov 2026——
10.2Pipes & Fittings InstallationIn Progress2.650.0%40%+40.0030%+1020 Oct 2026—22 Nov 2026——
10.3Testing – HydrotestNot Started0.200.0%0%0.000%0——23 Nov 2026——
11.1Electrical Cables, Switches, Trays, ConduitsNot Started2.650.0%0%0.000%0——21 Nov 2026——
11.2Level Control Panel InstallationNot Started2.450.0%0%0.000%0——17 Nov 2026——
11.3Pump Control Panel InstallationNot Started3.060.0%0%0.000%0——18 Nov 2026——
11.4Testing (electrical)Not Started0.200.0%0%0.000%0——19 Nov 2026——
12.1Function & Operation TestNot Started0.410.0%0%0.000%0——25 Nov 2026——
12.2Documentation & As Built DrawingsNot Started2.040.0%0%0.000%0——26 Nov 2026——
–Total — 20 activities100.0030.19%32.95%+2.75
Planned % is the weighted progress the baseline dates call for at the data date; current % is the percentage reported in the schedule; variance is current minus planned, in percentage points of the activity. Last week %, weekly gain, responsible and comment / evidence come from the weekly site report and are not carried in the schedule file, so they stay blank until the next update is entered; actual dates are shown only where the schedule records them.
11

1-week look-ahead

24 – 31 October 2026 · top 3 activities
Window from the data date
Fridays shaded (non-working). The week ahead holds the close-out of 9.1 and the second week of the tanks assembly.
9.1 Steel Beam Foundation75% · finish 21 Oct passed9.2 Tanks AssemblyStarted 18 Oct · 15% · to 15 Nov10.2 Pipes & FittingsEarly start 20 Oct · 40%Week to 31 OctData date 24 Oct17 Oct24 Oct31 Oct
Data date 24 Oct 2026┆ End of the seven-day window, 24 OctFinishing inside the windowStarting inside the window
Activities in the window, their target by 31 October and the control actions
WBSActivityWindowTarget % by 24 OctManpower / material readinessAction neededOwner
9.1Steel Beam FoundationClose-out · 31 Oct100.0%Requirement: remaining beams, bolts and grouting on site (confirm)Close the last 25% and sign 9.1 off. Finish of 21 Oct already passed, zero float, feeds the tanks assembly.—
9.2Tanks AssemblyContinue · 31 Oct48.0%Requirement: plate packs, crane and welding crew through November (confirm)Hold 38% by 31 Oct: 8 of the 21 working days are spent. 44.9% of the project weight, zero float.—
10.2Pipes & Fittings InstallationControl action · 31 Oct0.0%Early start on 20 Oct against a baseline start of 18 NovDecide the re-link to 10.1 and 10.3, or park the early work. Carries 1.06 pts of this week's progress.—
Target % is the completion the current dates call for by 31 October 2026. Owner, readiness and action are confirmed at the weekly progress meeting.
12

2-week look-ahead

Readiness board · 24 October – 26 November 2026
Upcoming activities requiring material, access, approvals, equipment, subcontractor or client coordination
No new activity starts between 24 and 31 October: the week is the tanks assembly and the two early starts. The next cluster is behind it — 8 activities carrying 23.7% of the weight all start between 16 and 18 November, while the tanks assembly is still running.
WBSActivityRequired byTypeRequirementWeightReadiness
9.2Tanks Assembly22 OctMaterial, subcontractor, equipmentTank plates and structural steel; erection crew; crane and lifting access44.90%—
10.1Pumps Installation16 NovMaterial, equipment, accessPumps and pipe spools on site; lifting and rigging; access to the pump room10.20%—
11.3Pump Control Panel Installation18 NovMaterial, approvalControl panel delivered; panel shop drawings approved3.06%—
11.1Electrical Cables, Switches, Trays, Conduits18 NovMaterialCables, trays, conduits and switches on site2.65%—
11.2Level Control Panel Installation16 NovMaterial, approvalLevel panel delivered; electrical shop drawings approved2.45%—
9.6Testing (tanks)18 NovClient coordination, accessAccess to tank internals; client witness for the test2.45%—
9.4Mechanical Level Indicator16 NovMaterialLevel indicator delivered1.63%—
9.3Ladder, Vent, SS Supports16 NovMaterialLadders, vents and stainless supports delivered0.82%—
12.1Function & Operation Test24 NovClient coordinationClient attendance; test packs issued0.41%—
Requirement types are read from the scope and the current dates of each activity. Readiness and owner are confirmed at the weekly progress meeting; the schedule file does not carry them.
13

Constraints and recovery actions

Open at the reporting date
BlockerAffected activitySchedule impactAction requiredResponsibleDue dateStatus
Steel beam foundation at 75% with its finish of 21 Oct passed9.1 → 9.23 days of exposure on the feeder to 44.9% of the weightClose the last 25% and sign 9.1 off—31 Oct 2026Open
Tanks assembly at 15% after the first week9.218 working days left to 15 Nov for 85% of the assemblyConfirm plate deliveries, crane and welding crew for two rings a week—31 Oct 2026Open
Pipes & fittings ahead of its logic (early start 20 Oct)10.2 → 10.1, 10.3+1.06 pts of progress, but the pumps and hydrotest sequence is overtakenRe-link 10.1, 10.2 and 10.3 at the next update, or park the early work—7 Nov 2026Open
No cost posted on the SAR 110,000 tanks package9CPI 1.15 and EAC SAR 212,450 rest on SAR 70,000 of recorded cost onlyCode and post the steel and tank invoices—31 Oct 2026Open
Four contractual milestones forecast 2 working days behindM3–M6+2 wd on 17, 18, 21 and 24 November; no float to absorb itTake the second day out before 15 Nov, inside the 9.2 and 10.1 windows—12 Nov 2026Open
No schedule buffer: 9 of the 15 open activities at zero total floatAll68.2% of the weighted works sit on the driving chainFreeze scope changes and hold the 16 Nov material and access commitments—16 Nov 2026Monitor
Blocker, impact and action are read from the schedule of 24 October 2026 and its cost columns. Responsible and status are entered at the weekly progress meeting.
14

Activity register

Baseline vs current, weight, cost and float
WBSActivityStatusWeight %% comp.Est. costActual costEVBaseline startBaseline finishCurrent startCurrent finishVar. wdTotal floatFree floatPredecessorsSuccessors
7.1Civil DrawingsCompleted 2.041005,0005,0005,000 15 Feb 202619 Feb 202615 Feb 202622 Feb 2026+2 ––––
7.2Mechanical DrawingsCompleted 2.041005,0005,0005,000 15 Feb 202621 Feb 202615 Feb 202621 Feb 20260 ––––
7.3Electrical DrawingsCompleted 2.041005,0005,0005,000 17 Feb 202624 Feb 202617 Feb 202623 Feb 2026−1 ––––
8.1Tanks & Pump Slab FoundationCompleted 14.2910035,00035,00035,000 14 Jun 202627 Jun 202614 Jun 202627 Jun 20260 ––––
8.2Pipe SupportsCompleted 2.451006,0006,0006,000 20 Jun 202630 Jun 202620 Jun 202630 Jun 20260 ––––
9.1Steel Beam FoundationIn Progress 3.06757,5007,5005,625 14 Oct 202619 Oct 202614 Oct 202621 Oct 2026+2 00–9.2 FS
9.2Tanks AssemblyIn Progress 44.9015110,000–16,500 22 Oct 202615 Nov 202618 Oct 202615 Nov 20260 009.1 FS9.3, 9.4, 10.1, 11.2
9.3Ladder, Vent, SS SupportsNot Started 0.8202,000–– 16 Nov 202616 Nov 202616 Nov 202616 Nov 20260 999.2 FS–
9.4Mechanical Level IndicatorNot Started 1.6304,000–– 16 Nov 202616 Nov 202616 Nov 202616 Nov 20260 009.2 FS9.5
9.5Overall FinishingNot Started 0.4101,000–– 17 Nov 202617 Nov 202617 Nov 202617 Nov 20260 009.4 FS9.6
9.6Testing (tanks)Not Started 2.4506,000–– 18 Nov 202619 Nov 202618 Nov 202619 Nov 20260 339.5 FS12.1
10.1Pumps InstallationNot Started 10.20025,000–– 16 Nov 202617 Nov 202616 Nov 202617 Nov 20260 009.2 FS10.2, 11.1, 11.3
10.2Pipes & Fittings InstallationIn Progress 2.65406,5006,5002,600 18 Nov 202622 Nov 202620 Oct 202622 Nov 20260 0010.1 FS10.3
10.3Testing – HydrotestNot Started 0.200500–– 23 Nov 202623 Nov 202623 Nov 202623 Nov 20260 0010.2 FS12.1
11.1Electrical Cables, Switches, Trays, ConduitsNot Started 2.6506,500–– 18 Nov 202621 Nov 202618 Nov 202621 Nov 20260 5510.1 FS–
11.2Level Control Panel InstallationNot Started 2.4506,000–– 16 Nov 202617 Nov 202616 Nov 202617 Nov 20260 119.2 FS11.4
11.3Pump Control Panel InstallationNot Started 3.0607,500–– 18 Nov 202618 Nov 202618 Nov 202618 Nov 20260 0010.1 FS11.4
11.4Testing (electrical)Not Started 0.200500–– 19 Nov 202619 Nov 202619 Nov 202619 Nov 20260 3311.3 FS, 11.2 FS12.1
12.1Function & Operation TestNot Started 0.4101,000–– 24 Nov 202625 Nov 202624 Nov 202625 Nov 20260 109.6 FS, 10.3 FS, 11.4 FS12.2
12.2Documentation & As Built DrawingsNot Started 2.0405,000–– 24 Nov 202626 Nov 202624 Nov 202626 Nov 20260 0012.1 SS–
–Total — 20 activities100.0032.95245,00070,00080,725
Values in SAR. Weightage and cost as carried in the schedule; EV = estimated cost × reported % complete.
15

Notes and methodology

  • Progress is weighted by the weightage of each activity held in the schedule; workstream progress is the weighted roll-up of its activities.
  • Planned progress is the weighted progress the baseline dates call for at the data date of 24 October 2026; PV, EV and AC use the cost carried by the activities.
  • CPI = EV ÷ AC; SPI = EV ÷ PV; EAC = BAC ÷ CPI; VAC = BAC − EAC.
  • Working calendar: Sunday to Thursday and Saturday, Friday non-working; the programme runs 245 working days from 15 February to 26 November 2026.
  • Baseline and current dates, predecessors and successors, weightage, cost and reported progress are taken from "NCT_Progress_Updated_oct_24_2026.xlsx", sheet "Gate Complex 1A1B", report of 24 October 2026.
  • Both updates are kept: this report (data date 24 October 2026) and the previous one of 17 October 2026, reachable from the Updates timeline and archived at update-2026-10-17.html. Last week % and weekly gain in the progress register are read from that previous update.
  • Site progress photos are in the Site Progress Photos gallery, grouped by report date with the titles used in the "Site Gallery" sheet of the report.
  • Total float is computed from the dependency links of the schedule.
  • Planned % per activity is the share of its baseline duration elapsed at the data date; current % is the percentage reported in the schedule; variance is current minus planned in percentage points of that activity.
  • Target % in the look-ahead is the completion the current start and finish call for at the end of the window, on the same working calendar.
  • Actual cost is the cost recorded up to the data date. The schedule repeats the activity budget in that column, so the SAR 110,000 tanks package (9.2, 15% complete) is carried at its earned value until its invoices are posted, and CPI and EAC are provisional.
  • Actual start and actual end are the dates recorded in the schedule; activities without a recorded actual date show a dash. Last week %, weekly gain, responsible person, comment / evidence and constraint status are entered from the weekly site report and are not carried in the schedule file.
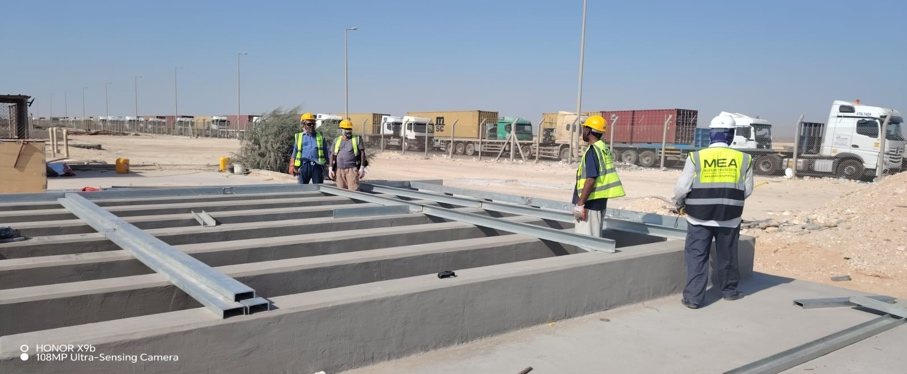
Appendix A — site progress photographs
Site Progress Photographs
NCT Water Pump Station · P.O. Number 3071 · 14 photographs from the weekly site reports of 17 and 24 October 2026
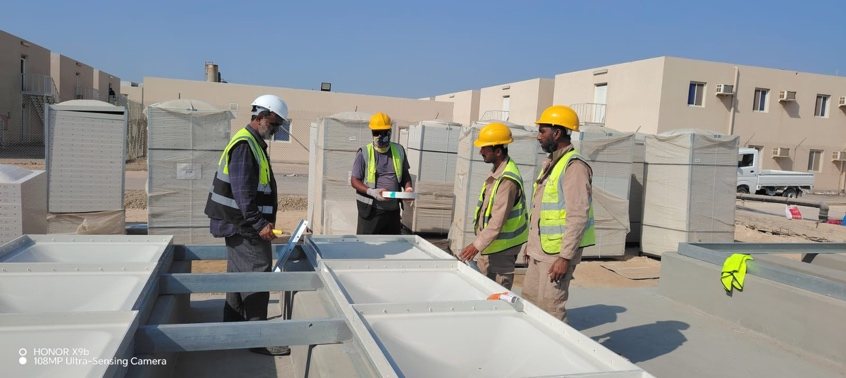
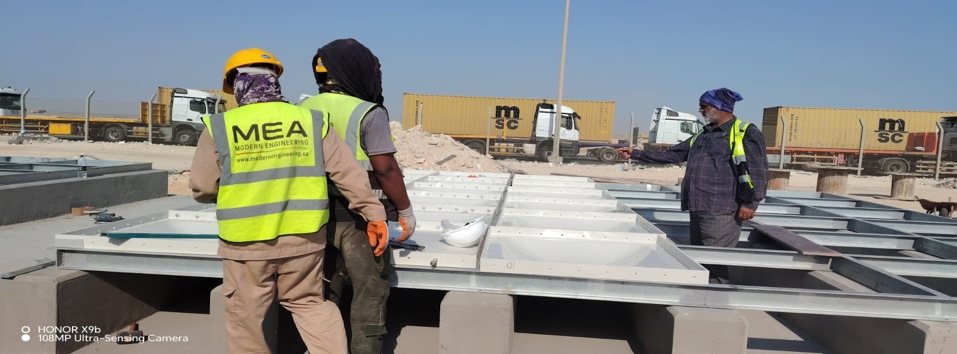
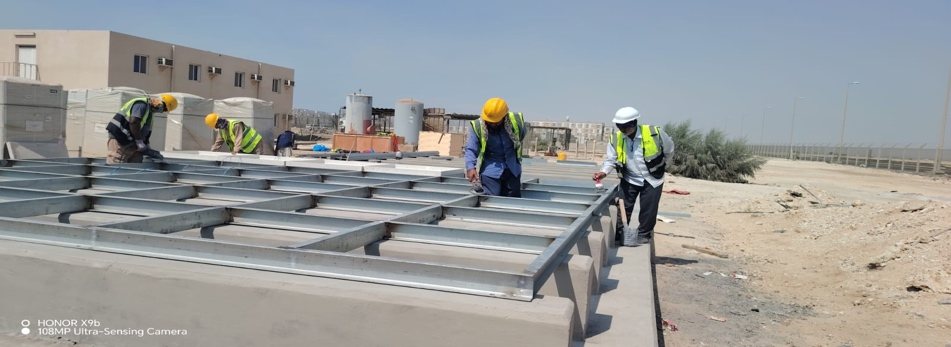
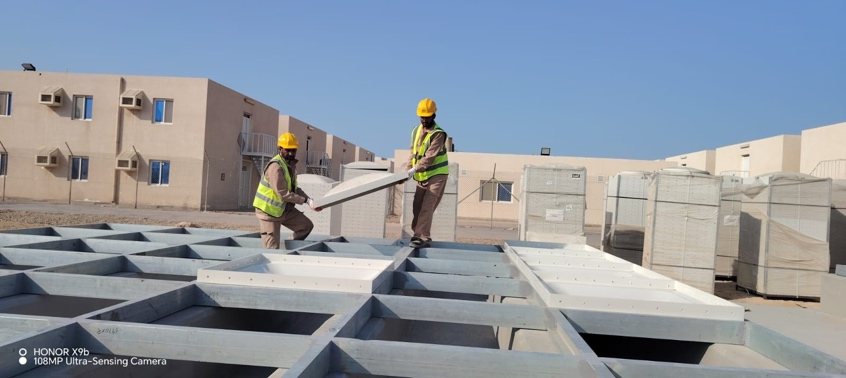
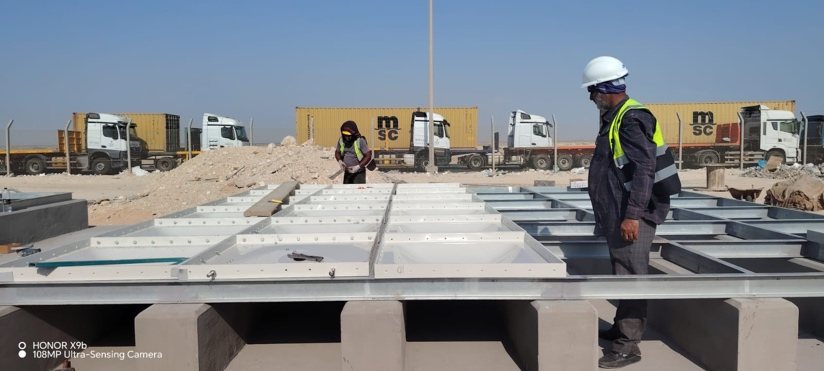
24 October 20269 photographs · tank erection, floor sheets
Tank Erection – Floor Sheets
01. Tank Erection – Floor Sheets24 October 2026
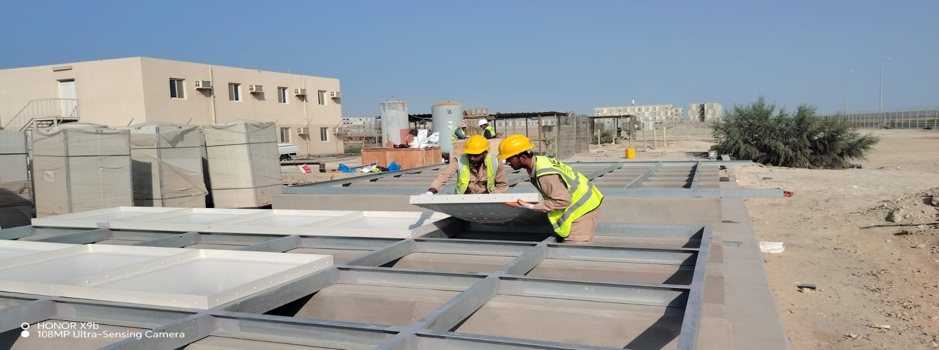
Tank Erection – Floor Sheets (2)
02. Tank Erection – Floor Sheets (2)24 October 2026
Tank Erection – Floor Sheets (3)
03. Tank Erection – Floor Sheets (3)24 October 2026
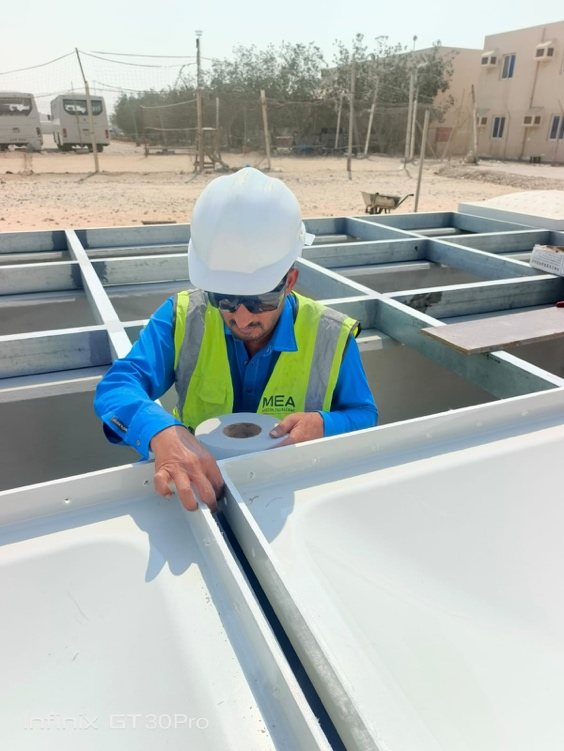
Tank Erection – Floor Sheets Inspection
04. Tank Erection – Floor Sheets Inspection24 October 2026
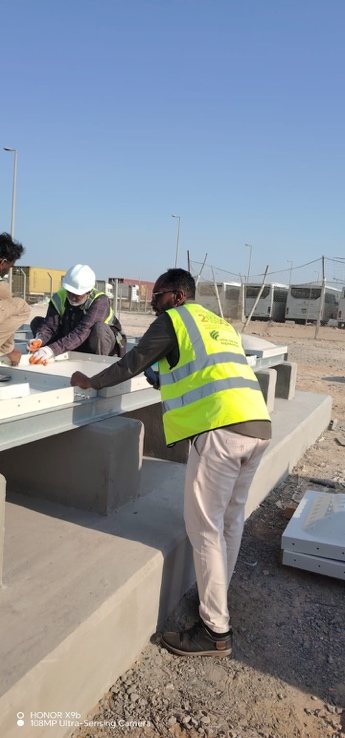
Installation of Tank Floor Sheets
05. Installation of Tank Floor Sheets24 October 2026
Installation of Tank Floor Sheets (2)
06. Installation of Tank Floor Sheets (2)24 October 2026
Floor Sheets Sealing
07. Floor Sheets Sealing24 October 2026
Tank Erection – Floor Sheets (4)
08. Tank Erection – Floor Sheets (4)24 October 2026
Tank Erection – Floor Sheets (5)
09. Tank Erection – Floor Sheets (5)24 October 2026
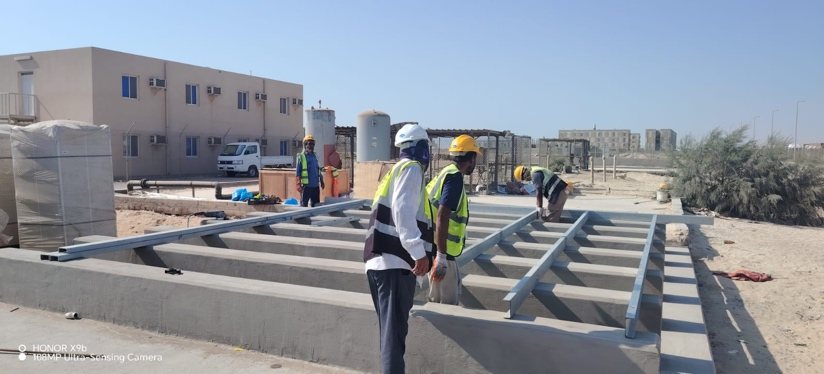
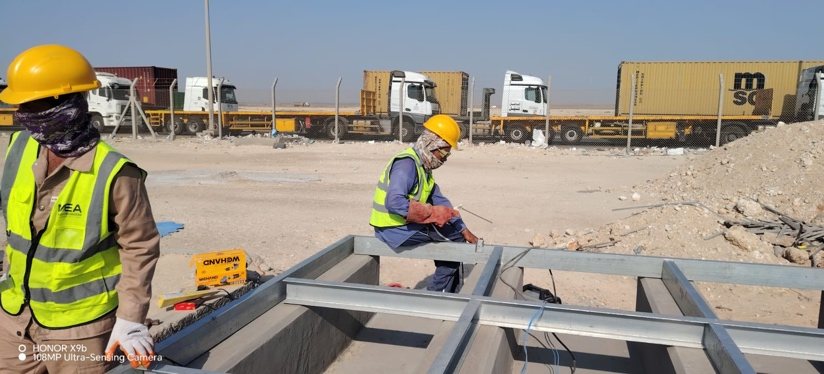
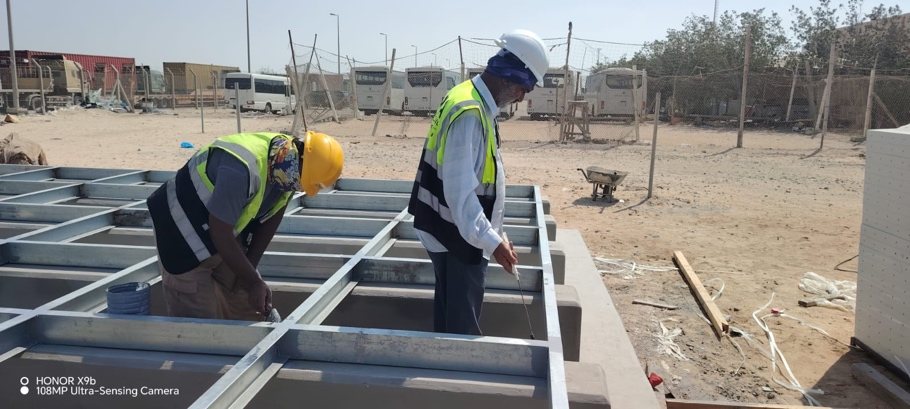
17 October 20265 photographs · steel skid, welding and cold galvanizing
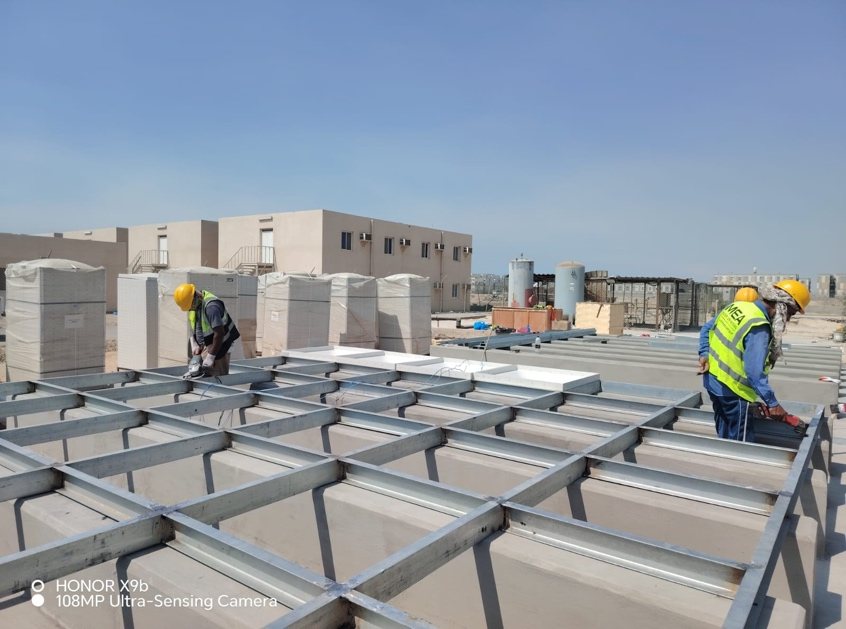
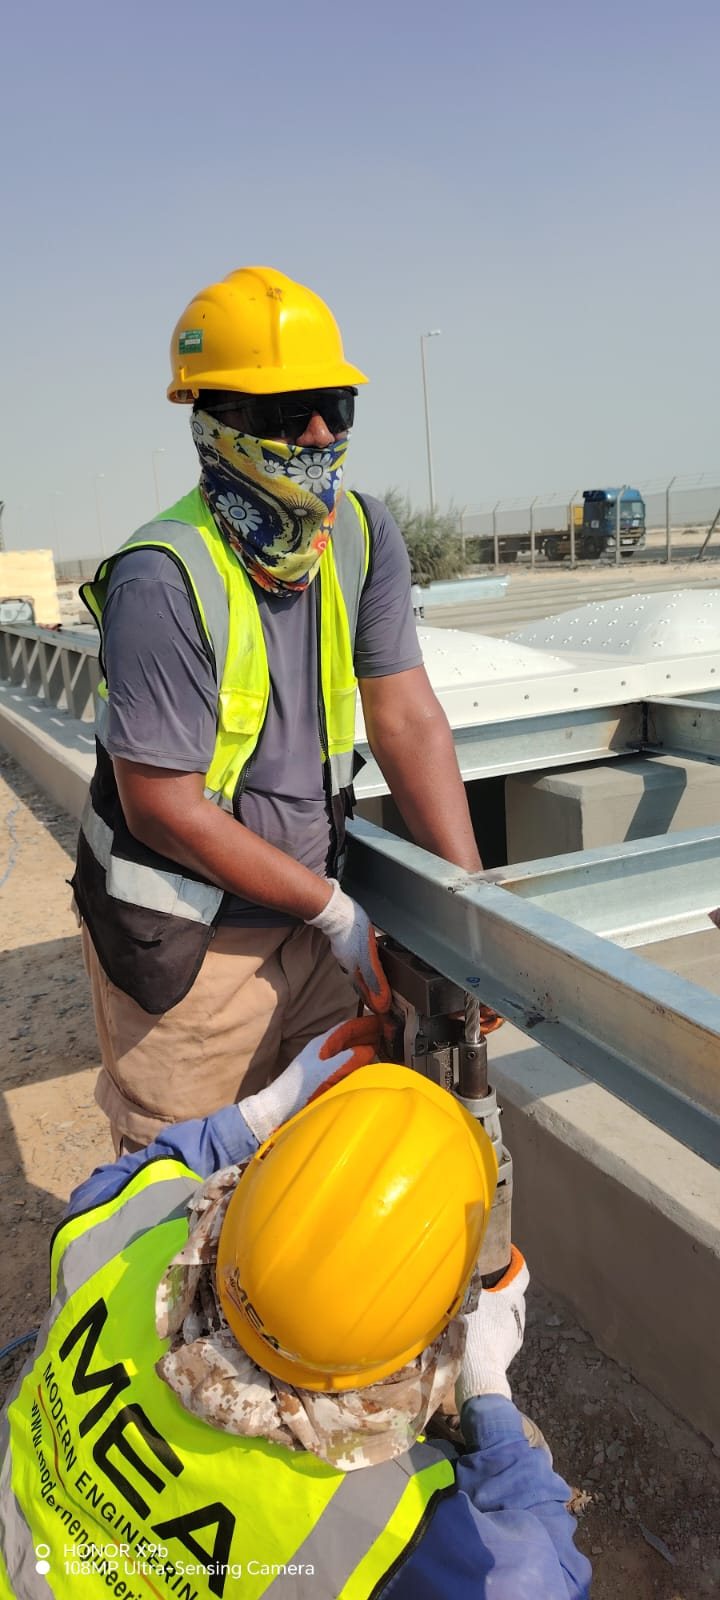
Steel Skid Erection
10. Steel Skid Erection17 October 2026
Steel Skid Erection – second view
11. Steel Skid Erection – second view17 October 2026
Welding of Steel Joints
12. Welding of Steel Joints17 October 2026
Cold Galvanizing Painting – 3 Layers
13. Cold Galvanizing Painting – 3 Layers17 October 2026
Steel Skid Erection Alignment
14. Steel Skid Erection Alignment17 October 2026
Titles as entered in the "Site Gallery" sheet of the weekly report. Photographs at full size: pdc-kap.roxyon.com/photos.html

Previous updates

Every report issued for this project. The current one is this page; the earlier ones are archived exactly as issued.
24 October 2026 Report as issued
Data date 24 October 2026 · weighted progress 32.95% against 30.19% planned · +2.75 pts · +7.15 pts in the week
Tanks Assembly (9.2) at 15% from an early start on 18 October; Pipes & Fittings (10.2) at 40% from an early start on 20 October; Steel Beam Foundation (9.1) at 75% with its planned finish of 21 October passed. Earned value SAR 80,725, cost recorded SAR 70,000.
  • Progress moved from 25.80% to 32.95% in the week.
  • Two activities started early; one is behind on dates (9.1).
  • Forecast completion unchanged at 26 November 2026.
This reportSite photos of 24 October
17 October 2026 Previous report
Data date 17 October 2026 · weighted progress 25.80% against 24.69% planned · +1.10 pts
Engineering drawings and civil works complete. Steel Beam Foundation (9.1) at 70% against 60% planned; Pipes & Fittings (10.2) reported 30% before its scheduled start; tanks assembly not started. Earned value SAR 63,200, cost recorded SAR 70,000.
  • Kept as issued: its figures are not restated.
  • Site photos of that week are in the same gallery.
Open the 17 October reportSite photos of 17 October